Animating Time Series Data

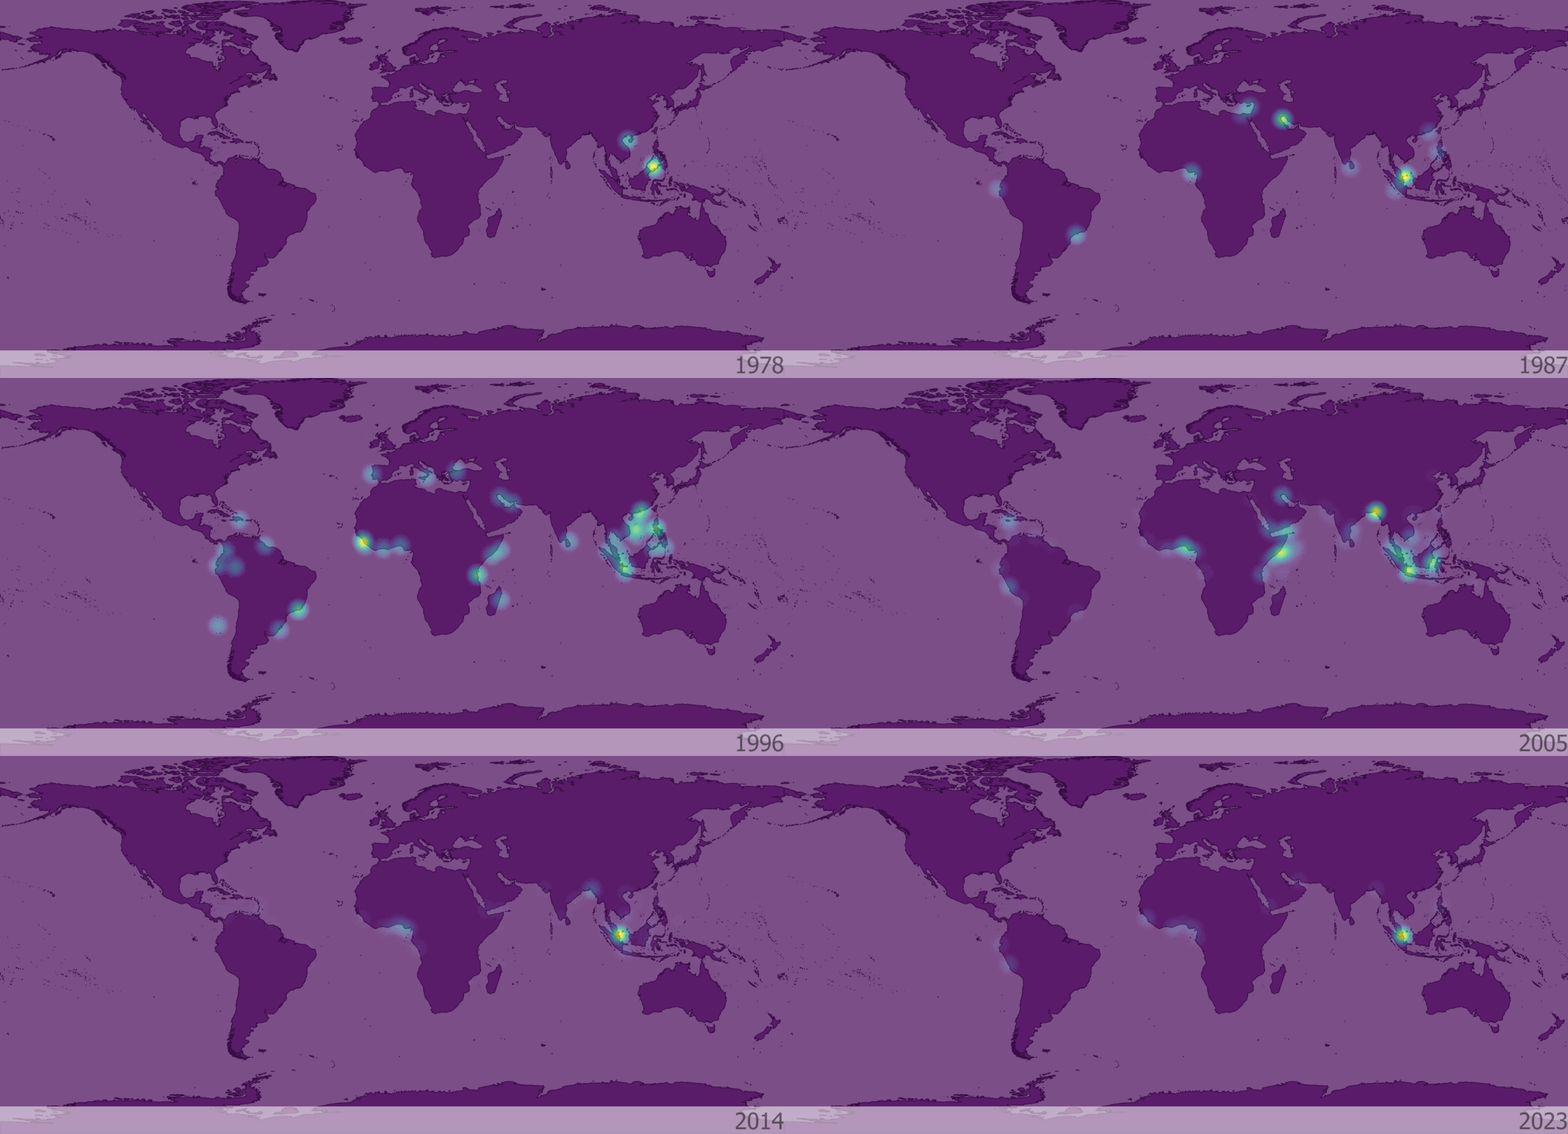
Description: By following an online tutorial, I took a point layer of maritime piracy incidents, created a heatmap visualization and created an animation of how the piracy hot-spots have changed over past 2 decades.
Tutorial: Animating Time Series Data (QGIS3) — QGIS Tutorials and Tips