Browsed by
Tag: Network analysis

The way to Hanoi by backroads

The way to Hanoi by backroads

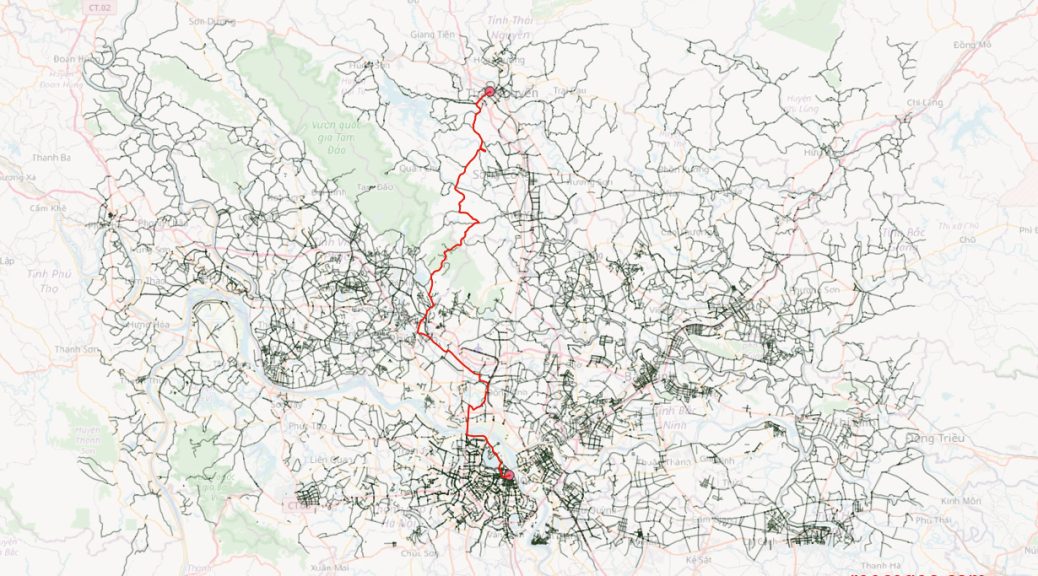
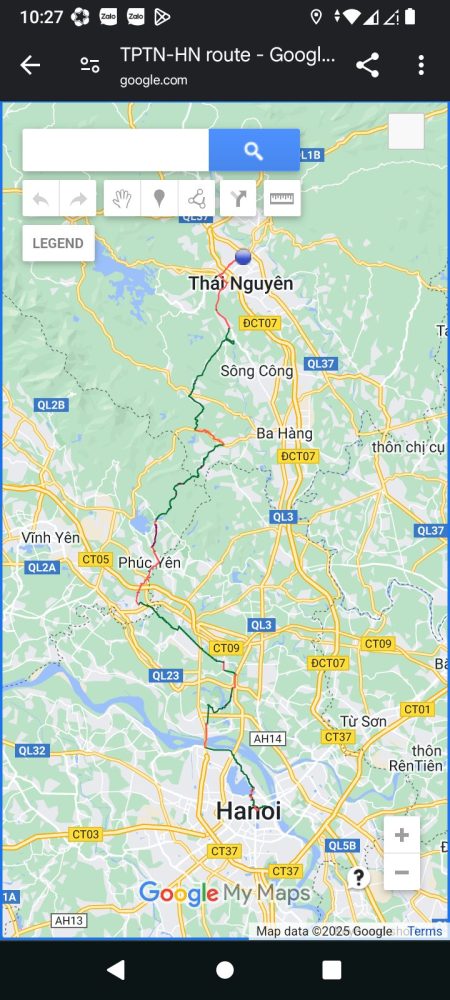
This is the way to Hanoi by backroads (excluding large highways, and prioritizing small roads over big roads)

I am located in Thai Nguyen city, which is about 80 km North of the Hanoi. The way to get to Hanoi is usually by bus, which travels on the motorway (aka freeway). I wanted to know if I can go to Hanoi on a bicycle, taking the back roads. The goal of this project was to find the optimal route to take by bicycle, with the priority being smaller roads.

First, I created a road network which excludes the major highways.

I know that I don’t want to ride my bicycle on the major highways at all, so I don’t need to include them in my road network. I downloaded from OSM only the highways in the smallest 3 classes.

Second, I prioritized smaller roads over bigger roads.

I prefer smaller roads, even if it means going a slightly greater distance. I want the tool to find the route that takes the smallest roads as much as possible.

Unclassified roads → Most preferred

Tertiary roads → Second priority

Secondary roads → Least preferred

To do this, I basically tell it, ‘smaller roads are faster, bigger roads are slower’. Then I tell it, ‘go find the fastest route’, and so it finds the route with more small roads.

In the attribute table of the highway layer, I used the field calculator to create a new field called ‘speed’. I calculated it as follows:

CASE
  WHEN "highway" IN ('unclassified', 'unclassified_link') THEN 30
  WHEN "highway" IN ('tertiary', 'tertiary_link') THEN 20
  WHEN "highway" IN ('secondary', 'secondary_link') THEN 10
END

I then ran the Shortest Path tool in QGIS with the “Fastest Path” option and the new attribute selected for the “Speed Field”. Since the tool prioritizes higher speeds, roads with higher values in the new field are preferred. The resulting output is more Tertiary highway than anything else.

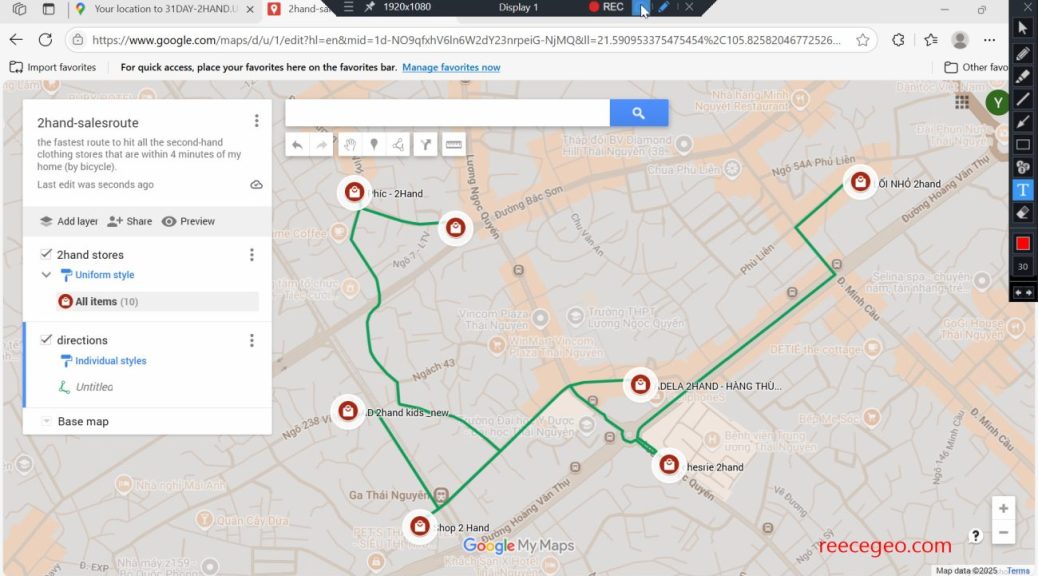
Finally, to view the route on my mobile phone while out cycling, I imported the route to Google my maps. Thanks to my phone’s GPS, I can see my location as a blue dot.

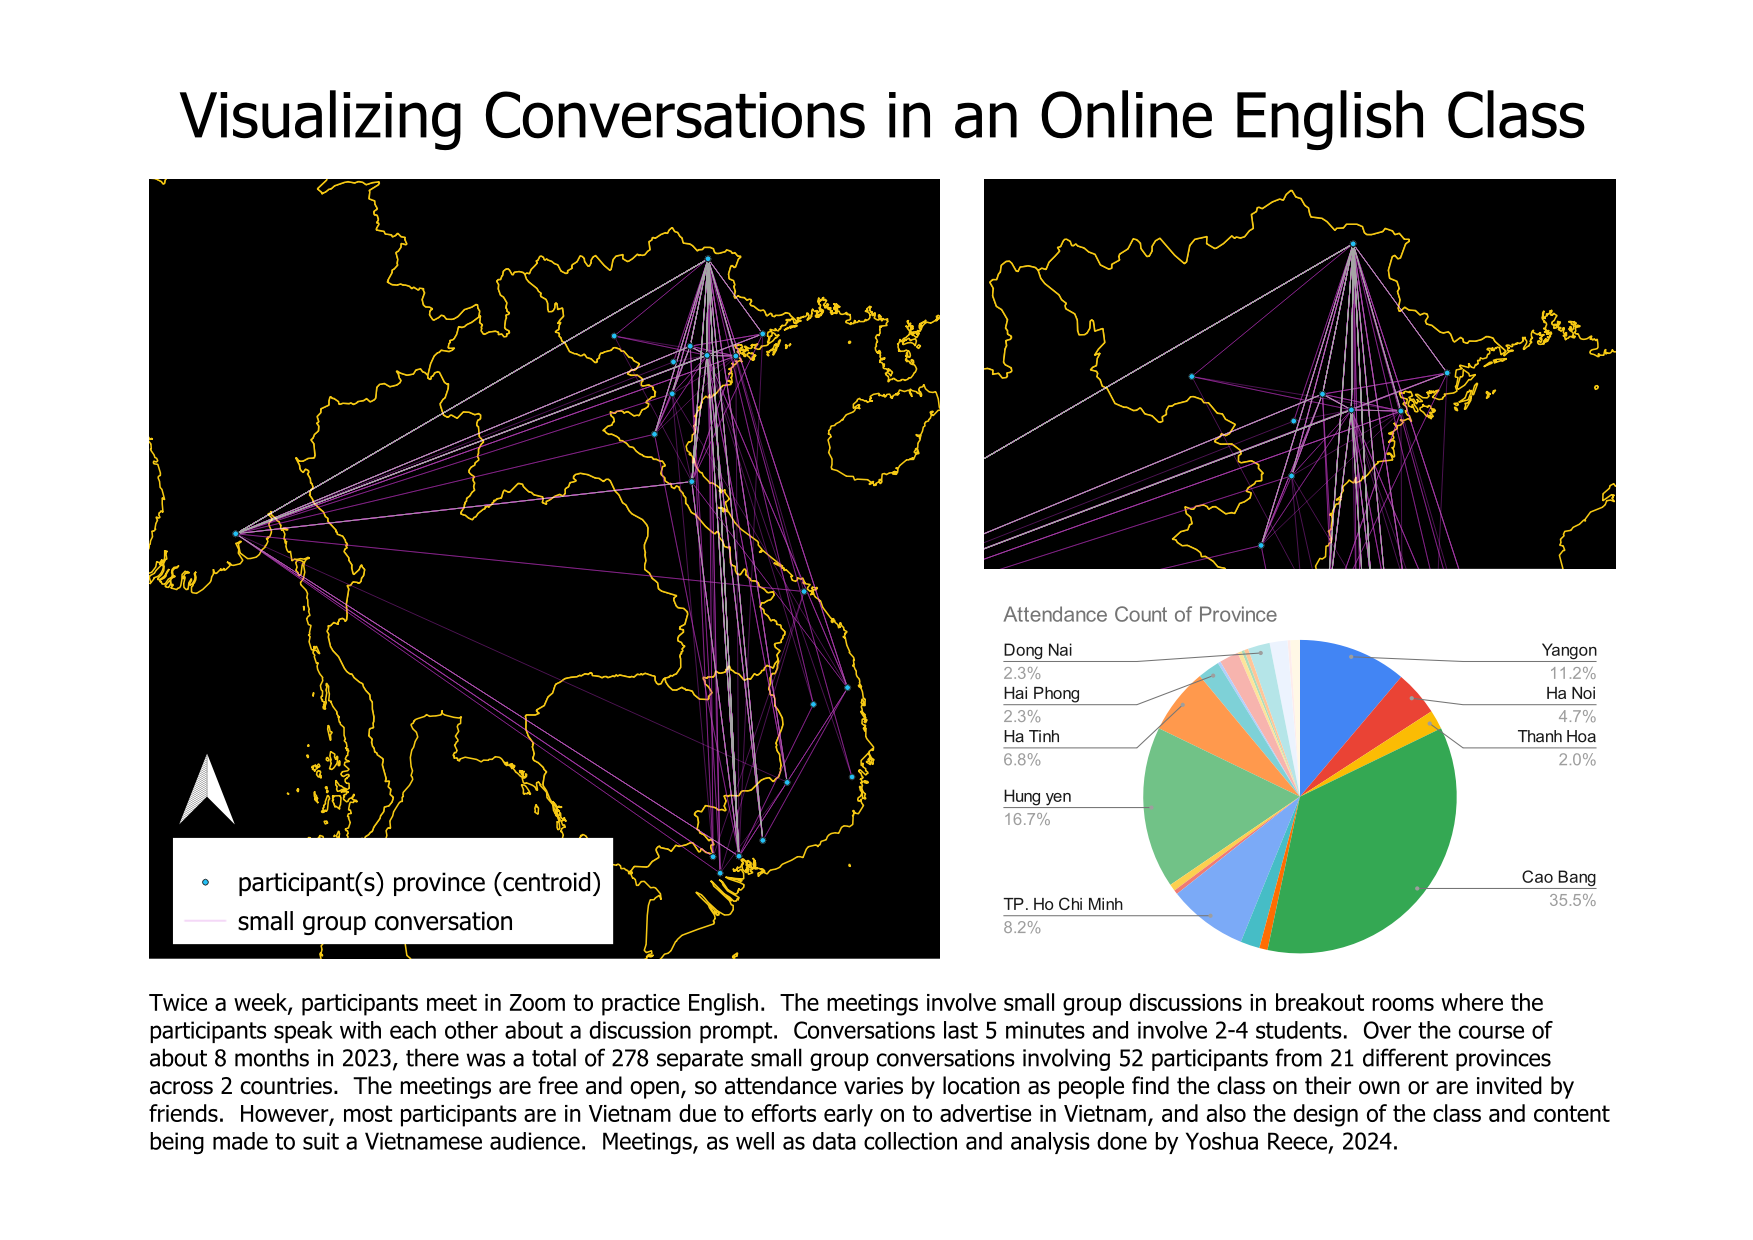
Visualizing conversations in an online English class

Visualizing conversations in an online English class

Twice a week, participants meet in Zoom to practice English. The meetings involve small group discussions in breakout rooms where the participants speak with each other about a discussion prompt. Conversations last 5 minutes and involve 2-4 students. Over the course of about 8 months in 2023, there was a total of 278 separate small group conversations involving 52 participants from 21 different provinces across 2 countries. The meetings are free and open, so attendance varies by location as people find the class on their own or are invited by friends. However, most participants are in Vietnam due to efforts early on to advertise in Vietnam, and also the design of the class and content being made to suit a Vietnamese audience.

Sông Cầu Streams and Watershed

Sông Cầu Streams and Watershed

Description: Shows the catchment area and contributing streams which feed the Sông Cầu in Thái Nguyên province, Vietnam . The two cities, Thái Nguyên and Bắc Kạn, are shown. Hydrological data was obtained from Hydrosheds.org, and elevation data was obtained from SRTM. Map was created in QGIS by Yoshua Reece, 2024.

Tools: QGIS, SRTM downloader plugin, clip.

Data: Hydrosheds.org, SRTM elevation data.