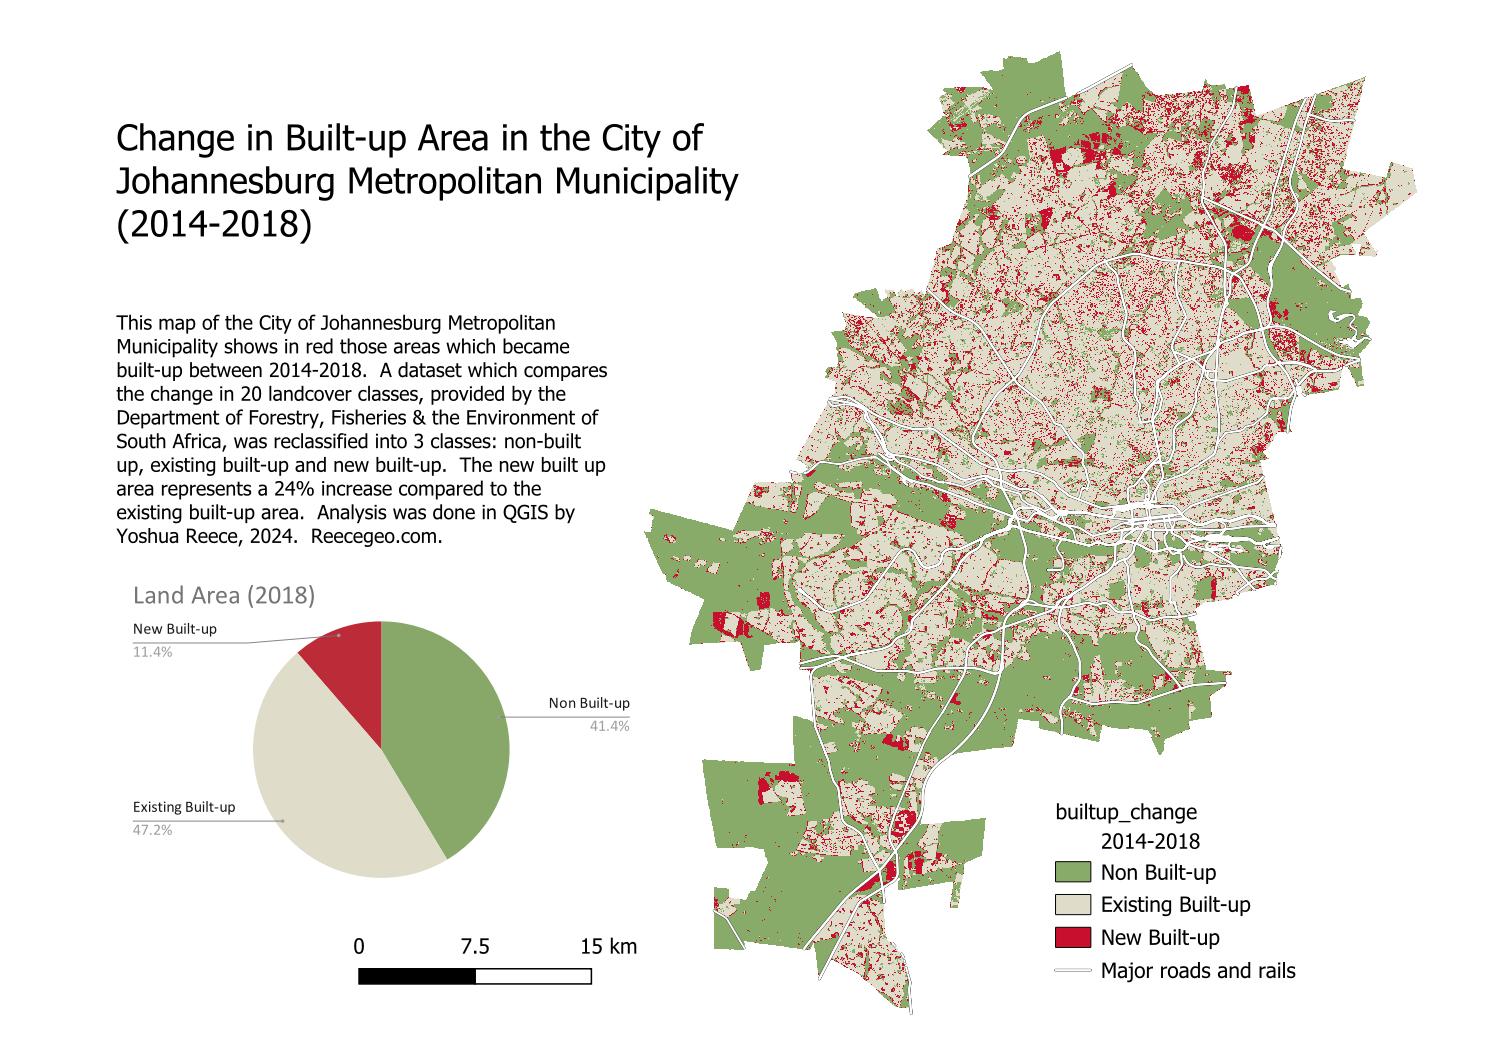
Change in Built-up Area in the City of Johannesburg Metropolitan Municipality (2014-2018)
This map was begun by following a tutorial, then extended. The tutorial was to use a change assessment dataset to identify urban growth patterns in the city of Johannesburg from 2014 to 2018. Once done, I added OSM features including major highways and rails. I calculated the raster area for the 3 classes and added a pie chart. Finally, I designed the print layout.


