Interpolating point data

Following a tutorial, I used a point layer of depth measurements taken by a depth sounder at a lake to create an elevation relief map and contours.

Following a tutorial, I used a point layer of depth measurements taken by a depth sounder at a lake to create an elevation relief map and contours.

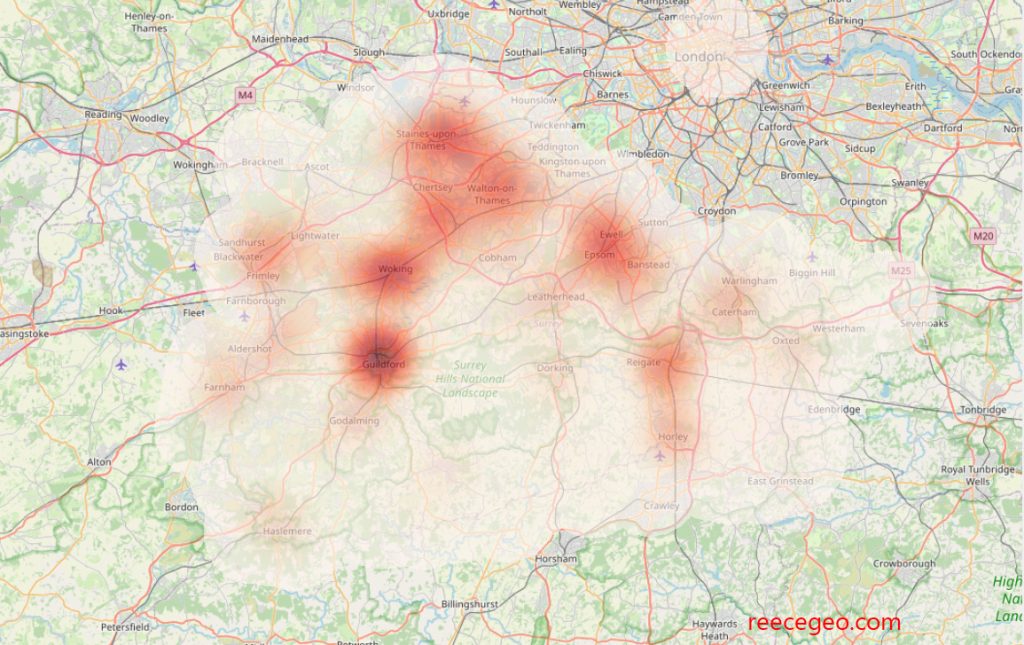
Following a tutorial, I worked with a dataset of crime locations in Surrey, UK and created a heatmap to visualize regions with high density of crime. I created a new attribute with a higher value for violent crimes, in order to give violent crimes relatively more weight in the heatmap.
Tutorial: Creating Heatmaps (QGIS3) — QGIS Tutorials and Tips