Sampling raster data


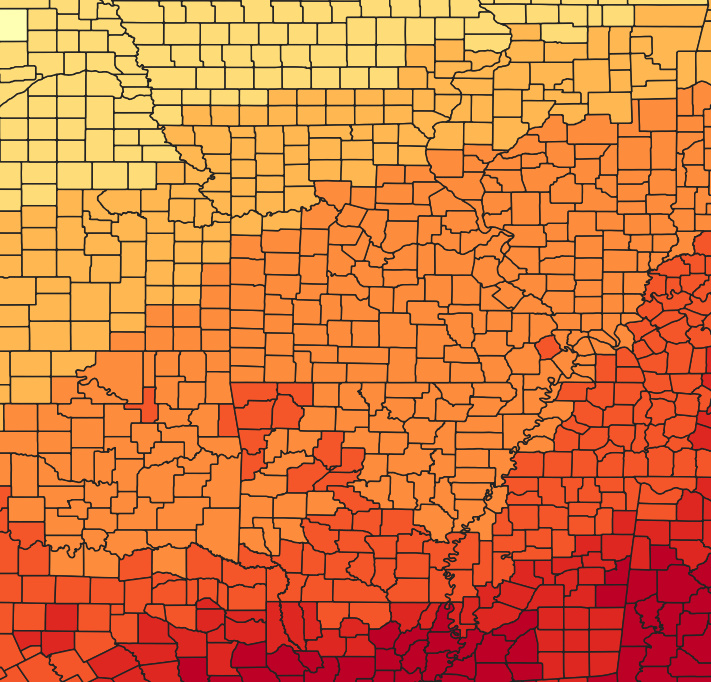
Using a raster grid of daily maximum temperature and also a US counties shapefile, I calculated the average value within each polygon using the zonal statistics tool. The result is a thematic map which shows US counties by maximum daily temperature.
Tutorial: Sampling Raster Data using Points or Polygons (QGIS3) — QGIS Tutorials and Tips