Interpolating point data

Following a tutorial, I used a point layer of depth measurements taken by a depth sounder at a lake to create an elevation relief map and contours.
Following a tutorial, I used a point layer of depth measurements taken by a depth sounder at a lake to create an elevation relief map and contours.
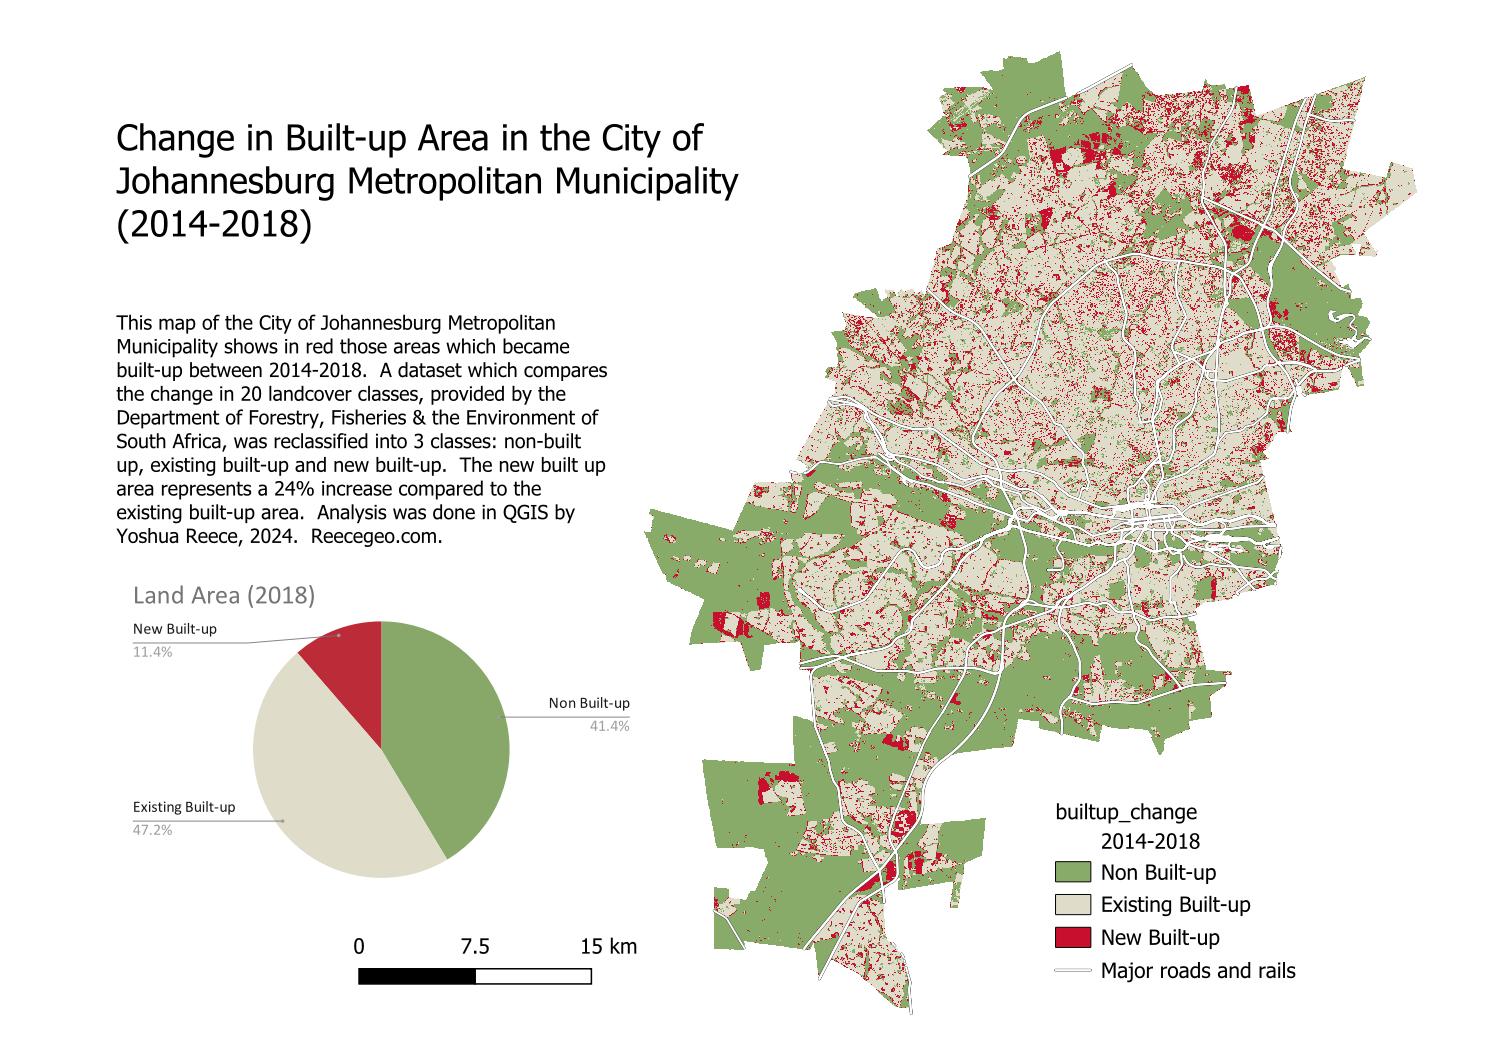
This map was begun by following a tutorial, then extended. The tutorial was to use a change assessment dataset to identify urban growth patterns in the city of Johannesburg from 2014 to 2018. Once done, I added OSM features including major highways and rails. I calculated the raster area for the 3 classes and added a pie chart. Finally, I designed the print layout.
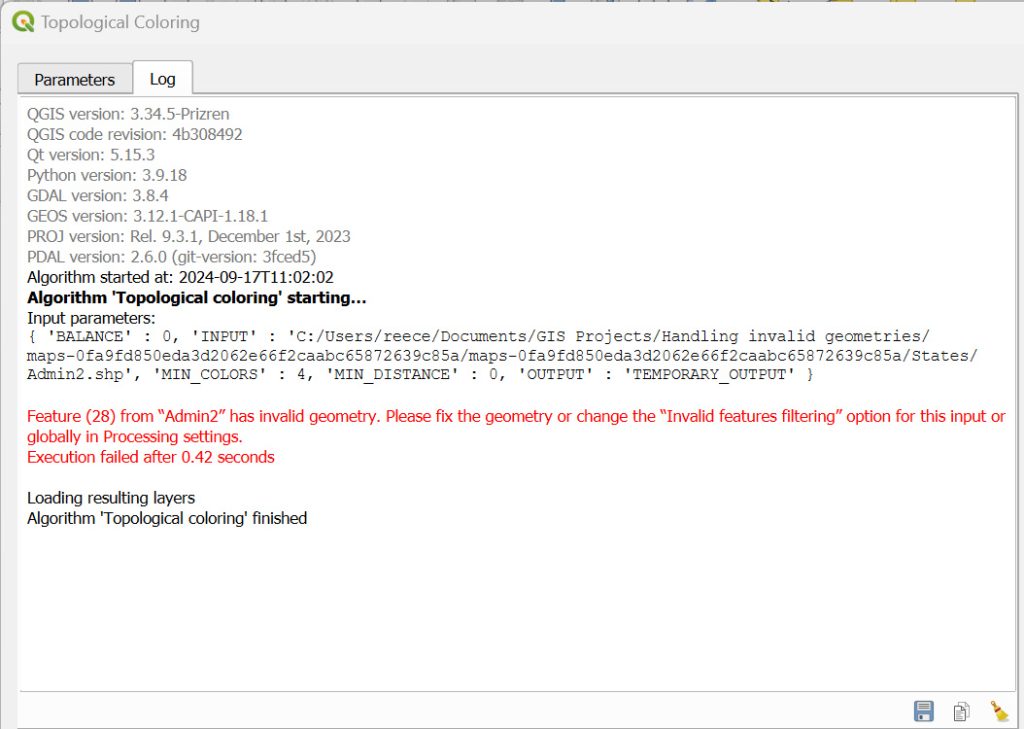
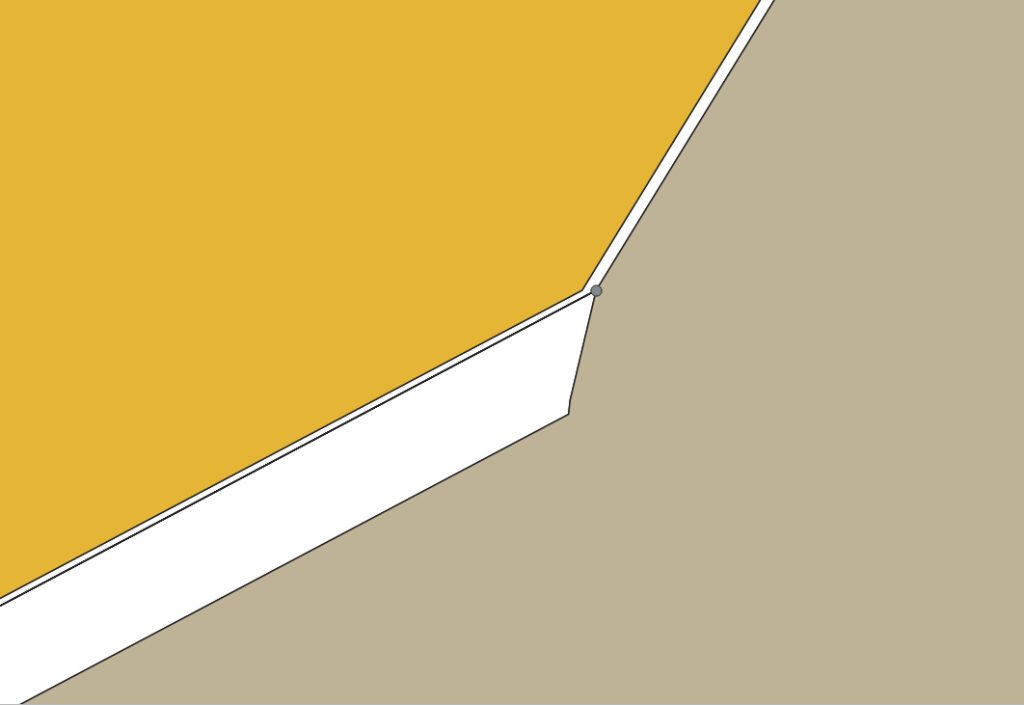


Following a tutorial, I fixed a geometry error in a state boundary layer. While attempting to run the ‘topological coloring’ algorithm, I encountered an error. I ran vector geometry>check validity to find the root cause. There was a ring self-intersection, which happens when a geometry touches itself and generates a ring. I used the vertex tool to edit the layer and fixed the geometry.
Handling Invalid Geometries (QGIS3) — QGIS Tutorials and Tips
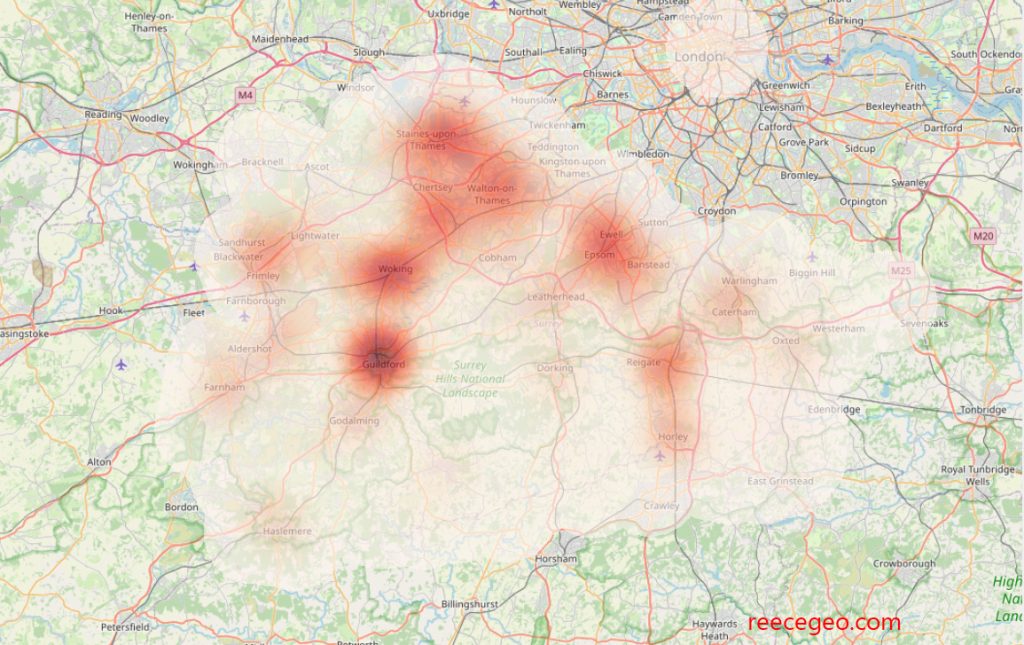
Following a tutorial, I worked with a dataset of crime locations in Surrey, UK and created a heatmap to visualize regions with high density of crime. I created a new attribute with a higher value for violent crimes, in order to give violent crimes relatively more weight in the heatmap.
Tutorial: Creating Heatmaps (QGIS3) — QGIS Tutorials and Tips
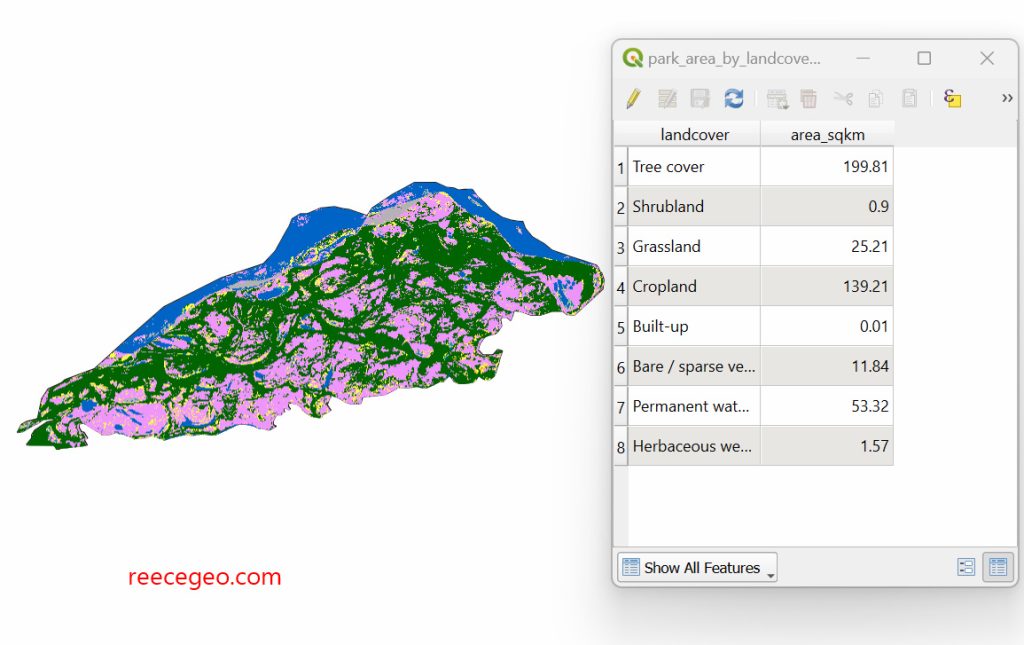
Following a tutorial, I used a raster layer with land cover classes and calculated the area of each class within a national park.
Tutorial: Calculating Raster Area (QGIS3) — QGIS Tutorials and Tips

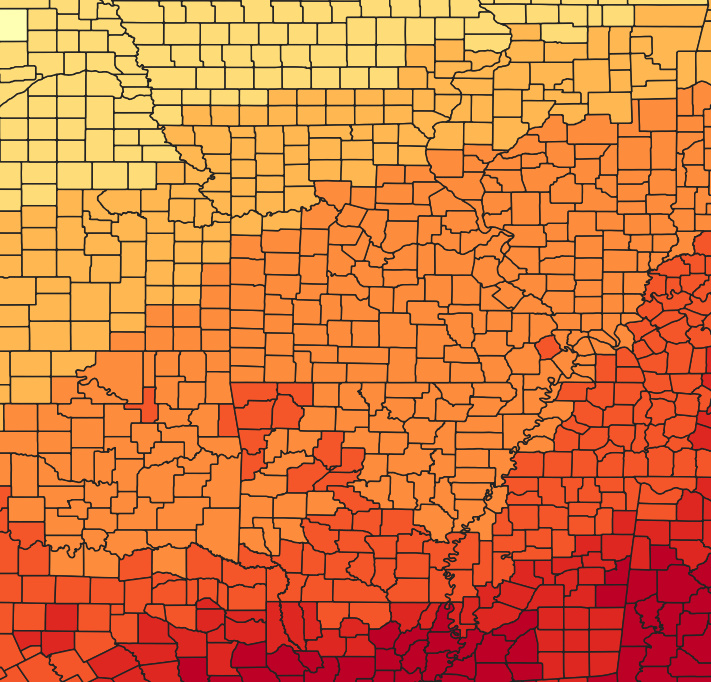
Using a raster grid of daily maximum temperature and also a US counties shapefile, I calculated the average value within each polygon using the zonal statistics tool. The result is a thematic map which shows US counties by maximum daily temperature.
Tutorial: Sampling Raster Data using Points or Polygons (QGIS3) — QGIS Tutorials and Tips
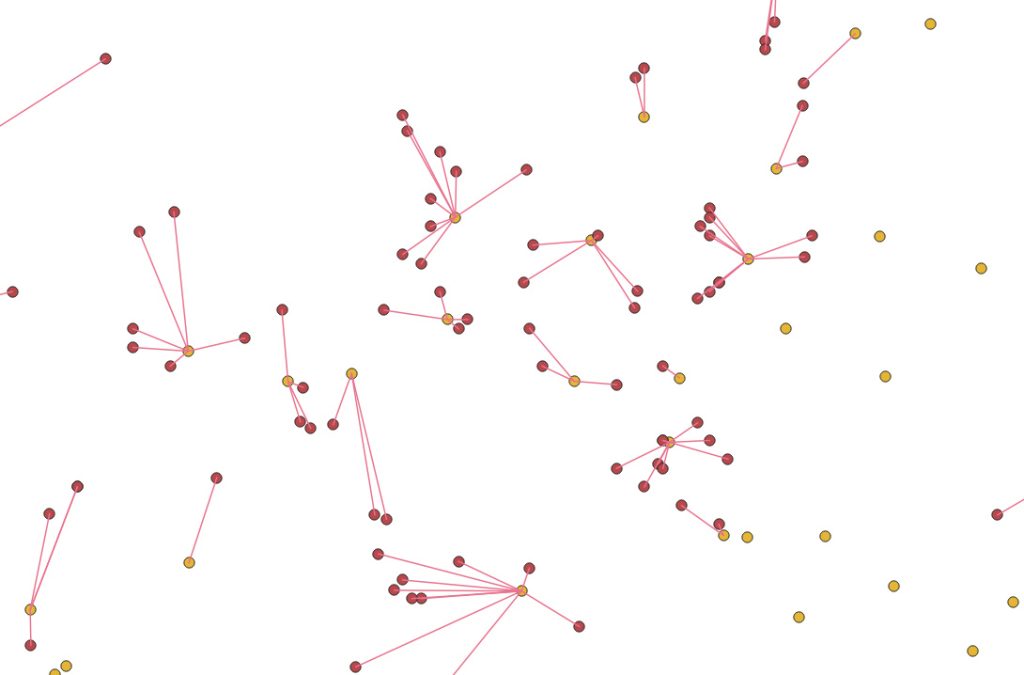
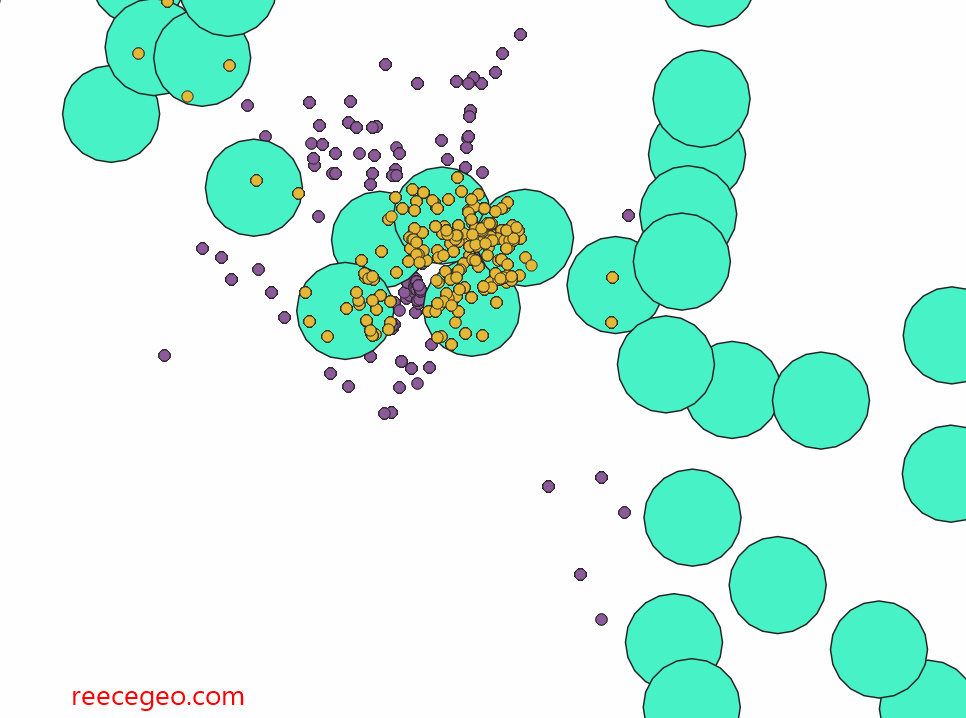
Following a tutorial, I performed a nearest neighbor analysis in QGIS using the ‘Distance to nearest hub’ tool. Using the tool, I created a line from each red point (historical earthquake) to its nearest yellow point (populated place).
Tutorial: Nearest Neighbor Analysis (QGIS3) — QGIS Tutorials and Tips
Following a tutorial, and using data from the city of Melbourne’s Open Data Platform, I performed a spatial query using the ‘extract by location’ tool to extract bars and pubs within 500 meters of a metro station.
Tutorial: Performing Spatial Queries (QGIS3) — QGIS Tutorials and Tips
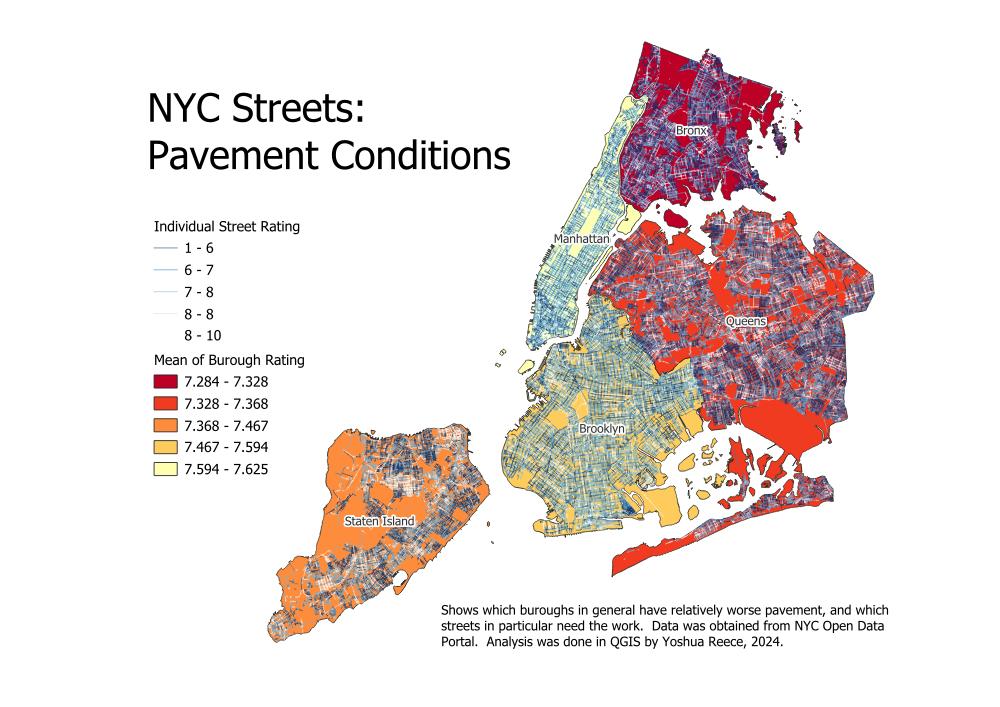
For this project I first followed a tutorial, then added to it by visualizing the result in a different way. The tutorial involved using the spatial join with summary algorithm to join the average street rating to each borough. I decided to use graduated symbology by the value of the pavement rating for both the boroughs and the individual streets to make a more effective thematic map.
Tutorial: Performing Spatial Joins (QGIS3) — QGIS Tutorials and Tips
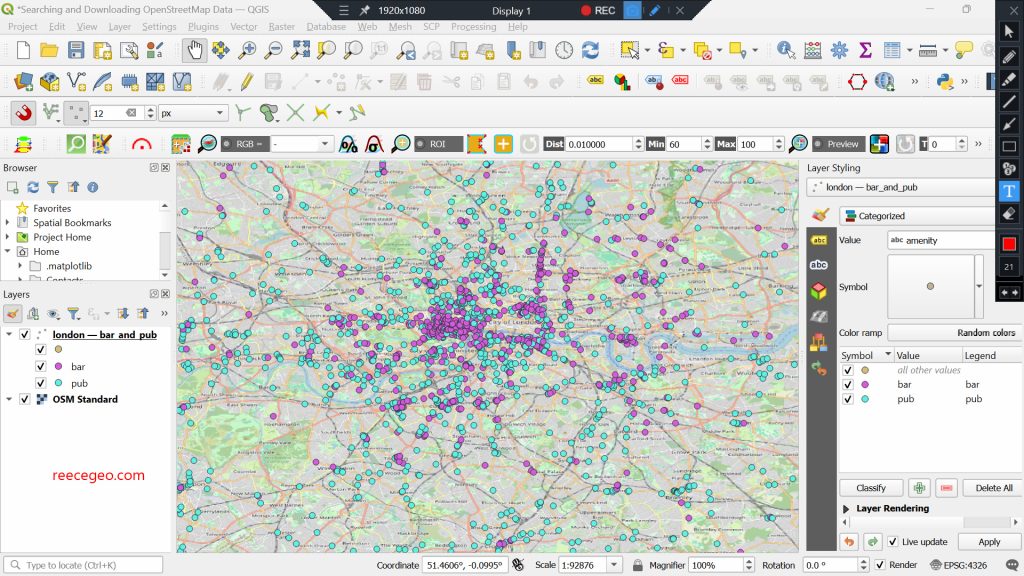
Following a tutorial, I extracted locations of all bars and pubs in London from the OpenStreetMap database and saved it as a vector layer.
Tutorial: Searching and Downloading OpenStreetMap Data (QGIS3) — QGIS Tutorials and Tips