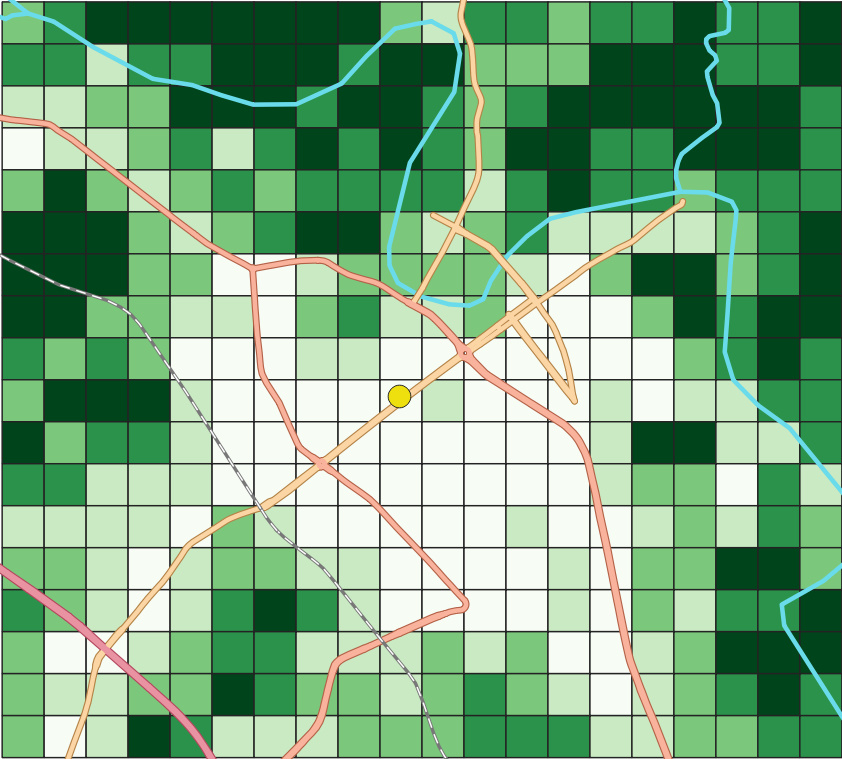
NVDI Analysis and Grid-based Visualization

Description: This map shows the distribution of surface vegetation in Thai Nguyen, Vietnam. An NVDI analysis was done using Landsat 8 images. The resulting raster was then made into a vector grid by overlaying a grid and using the zonal statistics tool. Finally, the primary roads and motorways are OSM data.
Tools: QGIS
Data: Landsat 8, OSM