Cracking open the box on PyQGIS
Since I completed the Learn Python 3 course on CodeCademy last week, I have been seeking an introduction to PyQGIS through a few avenues.
I first opened up a textbook called Extending QGIS with Python by Gary Sherman. I was daunted by having to download Python and some other things (Qt5?) that I had never heard of. The way that the book explains how to install these things, I just felt like it assumes I know my way around a computer more than I do. Maybe this book is for a more advanced level than I am. I decided to try out other resources.
I then chatted with chatGPT about learning PyQGIS. I fiddled around with copying different scripts that ChatGPT gave me into the QGIS python console and seeing the outputs. That was valuable, at least in how it showed me how the Python console in QGIS can be used. Additionally, I tried just retyping chatGPT’s scripts into a notepad as an exercise to familiarize myself with the functions and syntax of PyQGIS. I found that I could read and understand a lot more after the Python course I took.
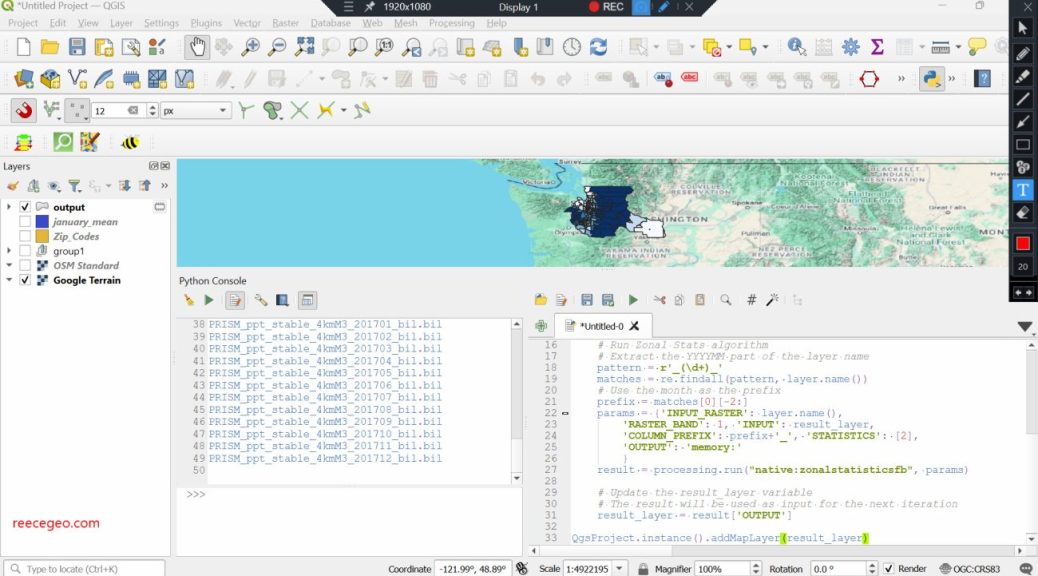
I still felt that learning from a book or tutorial created by a human was a better way, so I thought to try going back to qgistutorials.org for the PyQGIS tutorials there. I’ve already completed many other tutorials produced by Ujaval Gandhi, so they are easy for me to follow. I did the first two (of seven) tutorials. The below map of mean annual rainfall in Seattle was the product of the second tutorial, in which I used the zonal statistics tool on 12 raster layers at once using the Python console.
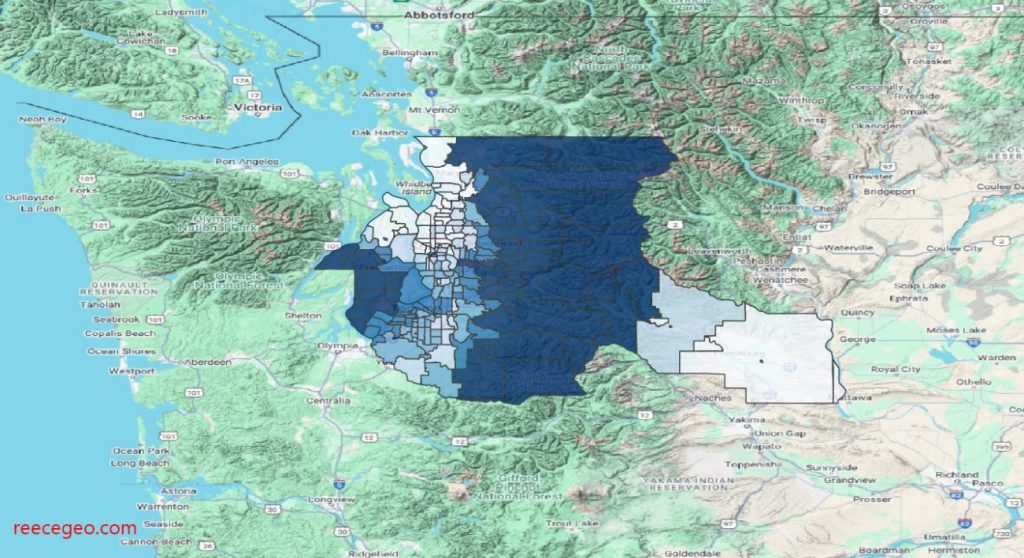
By the way, the pattern of more rainfall over the mountains is caused by something called orographic lifting, “where moist air is forced to rise over the mountain slopes, causing it to cool and condense into precipitation, leading to heavier rainfall on the windward side of the mountain range”.