Browsed by
Category: QGIS

Working in QGIS

Albuquerque Vertical Control Monuments

Albuquerque Vertical Control Monuments

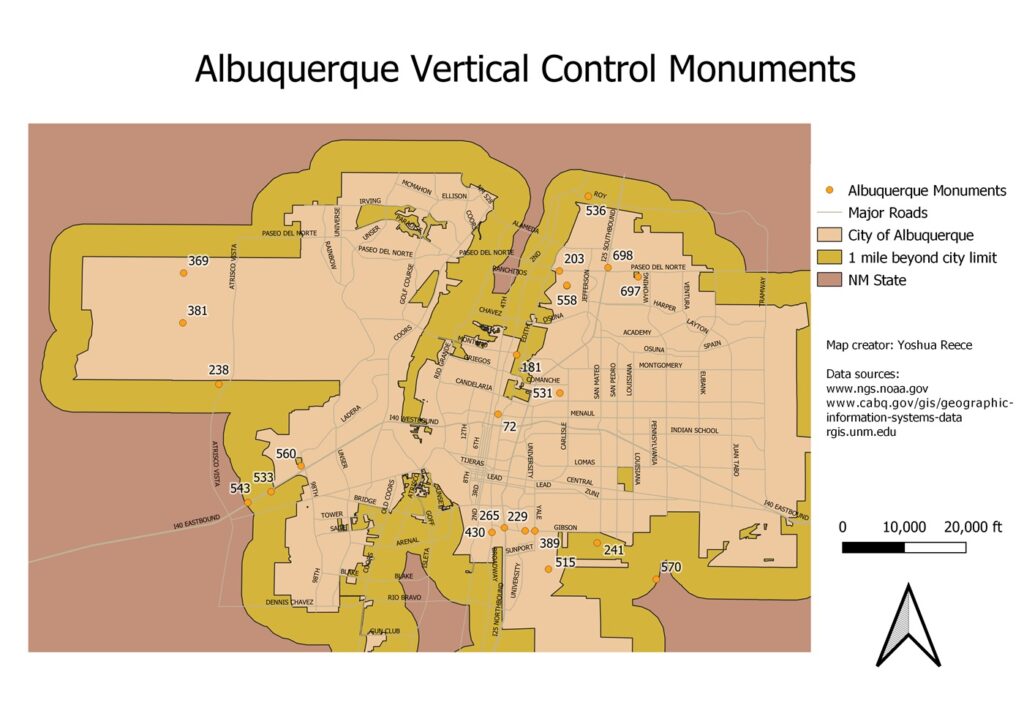
Description: Vertical control monuments, or survey markers, are markers placed in key points on the Earth’s surface, used in land surveying. The map was the product of a lab done in the course “Geospatial Technology” taught by the instructor John Beltran at Central New Mexico Community College. In the lab, I performed a basic spatial analysis using various data. Although the analysis is simple, I was performing quite a few tasks, including creating queries.

Greater sage-grouse distribution

Greater sage-grouse distribution

Description: This map shows the current distribution of greater sage-grouse habitat over different types of federal lands. The map was the product of a lab done in the course “Geospatial Technology” taught by the instructor John Beltran at Central New Mexico Community College.

Rice Paddy Yield by Province in Vietnam (2020)

Rice Paddy Yield by Province in Vietnam (2020)

Description: This thematic map shows rice paddy yield of the 63 provinces of Vietnam. The map makes it easy to identify the regions with the highest yield. As expected, the Red River delta and the Mekong River deltas are among the highest yield regions.

Data: provided by the general statistics office website of the Vietnamese government.

Tools: QGIS

Importing Spreadsheets or CSV files

Importing Spreadsheets or CSV files

Description: This is the product of a tutorial I followed. For this tutorial, I downloaded a dataset of earthquakes between 1900-2000 from NOAA’s National Geophysical Data Center. I then imported the tab delimited file into QGIS. I went a little further by adjusting the symbology to graduated based on the earthquake magnitude.

Tools: QGIS, file manager, layer properties/symbology.

Tutorial: Importing Spreadsheets or CSV files (QGIS3) — QGIS Tutorials and Tips

Visualizing conversations in an online English class

Visualizing conversations in an online English class

Twice a week, participants meet in Zoom to practice English. The meetings involve small group discussions in breakout rooms where the participants speak with each other about a discussion prompt. Conversations last 5 minutes and involve 2-4 students. Over the course of about 8 months in 2023, there was a total of 278 separate small group conversations involving 52 participants from 21 different provinces across 2 countries. The meetings are free and open, so attendance varies by location as people find the class on their own or are invited by friends. However, most participants are in Vietnam due to efforts early on to advertise in Vietnam, and also the design of the class and content being made to suit a Vietnamese audience.

Sông Cầu Streams and Watershed

Sông Cầu Streams and Watershed

Description: Shows the catchment area and contributing streams which feed the Sông Cầu in Thái Nguyên province, Vietnam . The two cities, Thái Nguyên and Bắc Kạn, are shown. Hydrological data was obtained from Hydrosheds.org, and elevation data was obtained from SRTM. Map was created in QGIS by Yoshua Reece, 2024.

Tools: QGIS, SRTM downloader plugin, clip.

Data: Hydrosheds.org, SRTM elevation data.