Browsed by
Category: QGIS

Working in QGIS

Fastest route analysis using QGIS and Google maps

Fastest route analysis using QGIS and Google maps

Since I am preparing to move again, I need to start getting rid of the stuff that I’m not going to take. One of the main things is the clothing that I’ve accumulated over the last year. I will take it to the second-hand shops and see if I can sell it. I expect that I will need to visit multiple shops in order to get rid of all of it. My objective is to find the shortest route to hit the nearest several 2hand shops.

I opened Google Earth Pro. I typed ‘Thai Nguyen’ to navigate to my city. I then typed ‘2hand’, which is the local name for second-hand clothing stores. The results appeared on the map. I clicked the ‘copy to clipboard as kml’ button, and pasted onto a blank notepad, saving that as 2hand.kml.

I opened a new project in QGIS and added the 2hand.kml layer. The points appeared on the canvas. I also added a Google road basemap.

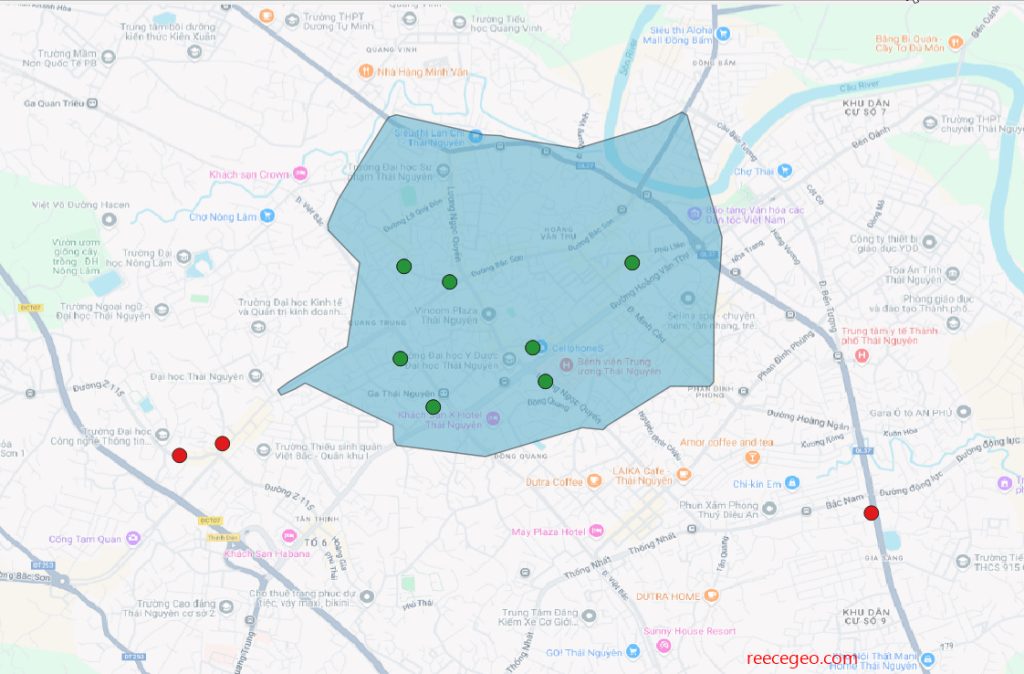
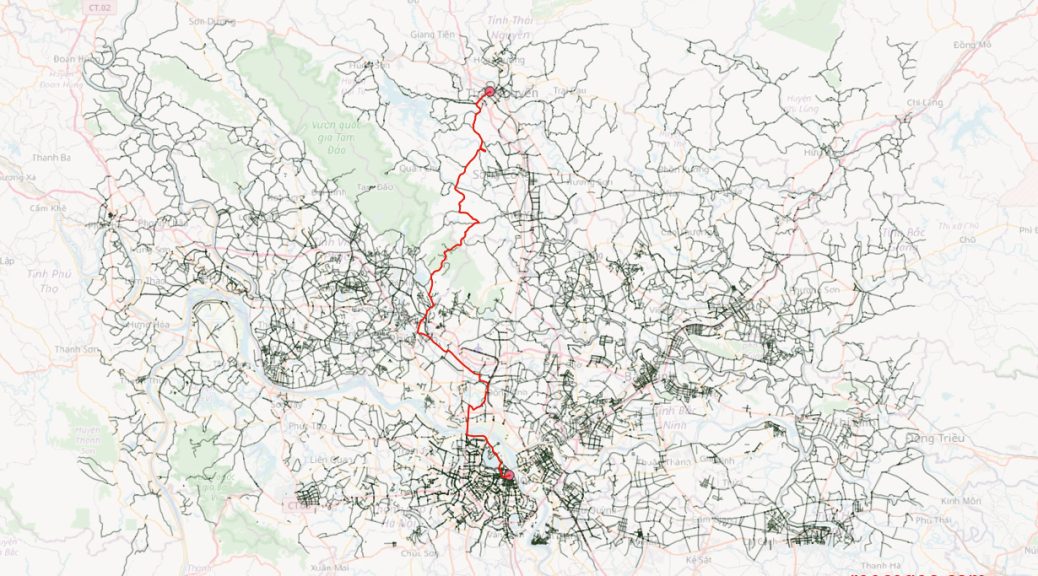
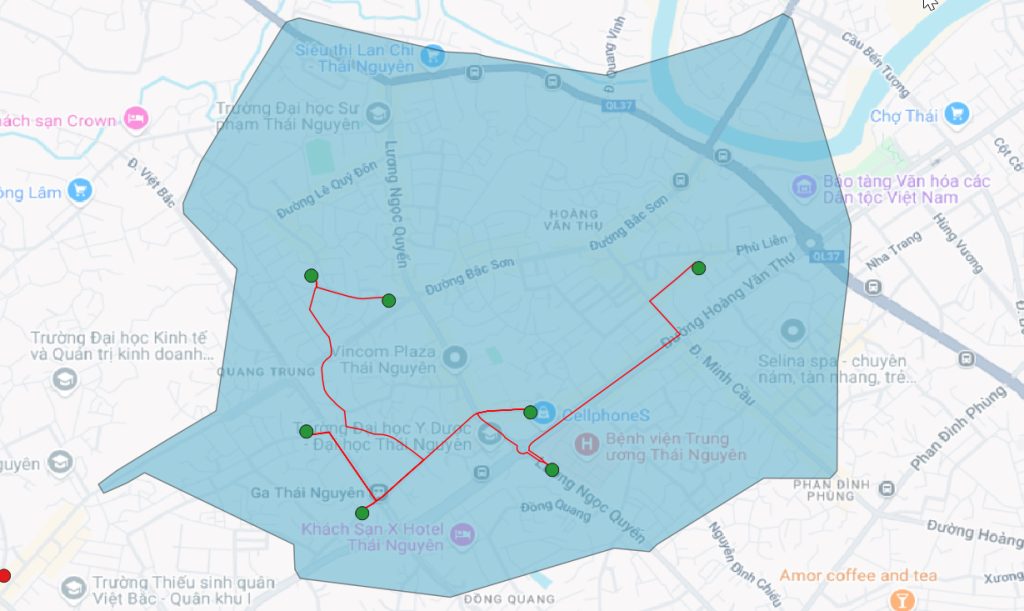
I created an isochrone, which shows as a polygon how far I can bicycle from home in 4 minutes, in every direction. I then found the fastest route to reach all the points contained in that polygon.

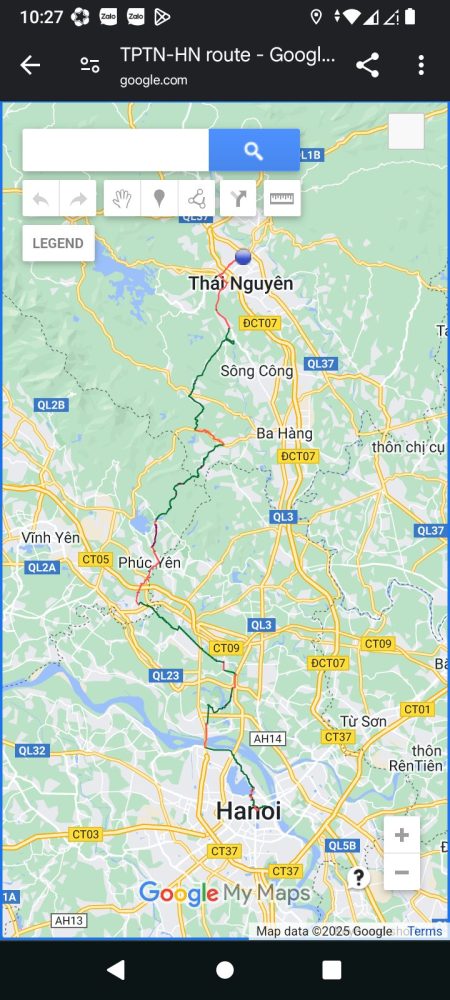
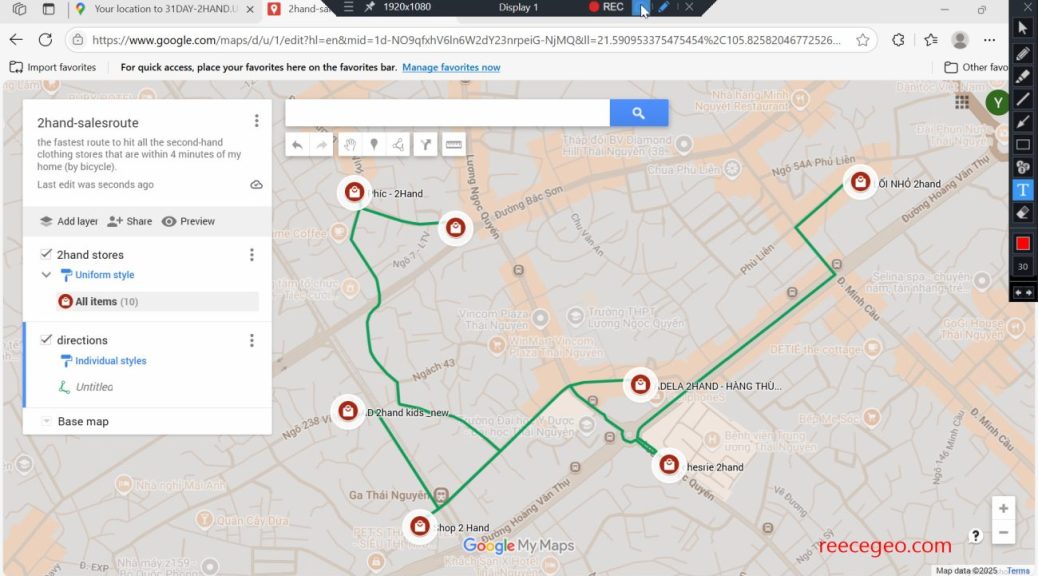
I exported the route as a KML file and imported that into Google maps. Now I can use the google maps app on my phone to view my route and navigate from point to point on my bicycle.

One note: Not all of the route seems to me like the fastest route. I’m sure the algorithm calculated what it was supposed to calculate, but somehow the result isn’t perfect. So, I’ll use the route as a guide, but depart from it slightly as needed. The fastest route analysis was still useful in showing the general order of stores that I should follow.

Process of learning from a textbook

Process of learning from a textbook

In this post, I will write some about how I’ve adapted to learning from a textbook. Though I did learn using a textbook in community college, that was as part of an instructor-led course, so there was more guidance. Since I started learning on my own, I have been using websites which integrate many more screenshots and other supporting features. Now that I have begun learning from a traditional textbook, it requires more initiative and resourcefulness on my part. This was a change, but I feel I have adapted to it.

One of the most important things I’ve learned to do is to retype all code I find in the book. I keep the notepad open in a small window at the top of my screen, and any code I see in the book, I retype in the notepad. This helps to examine closely and understand the code in detail.

Today, I progressed 5 more pages in the textbook. Below is a screenshot of a temporary memory layer I added (there’s a line between two points, but it’s hard to see).

Beginning to make progress with learning PyQGIS

Beginning to make progress with learning PyQGIS

Since writing my last post, I have both gone on to do another tutorial with qgistutorials.org as well as give the book PyQGIS Programmer’s Guide another try.

In this tutorial from qgistutorials.org, I used a custom Python expression and the map tips feature in QGIS to display the name and UTM zone of a city when you hover the mouse over it (shown in the feature image of this post).

The tutorial itself was easy, since it wasn’t about learning to write the code itself, just how to add the custom expression in QGIS. Still, I retyped the given code into a notepad as a learning exercise.

I’ve also made another attempt to learn from The PyQGIS Programmer’s Guide by Gary Sherman, and this time has had more momentum. The first attempt I was daunted by everything it instructed to do to set up the development environment, such as having Qt5 and having qgis installed in a directory without any spaces in the path, etc. It was a lot to take in. But I took it bit by bit and googled a lot of things, and got past it. I realized that OSGeo4W contains everything I need, and I re-downloaded it to a directory which contains no spaces.

I’ve been going through the book page by page, with QGIS open and looking at both as I go. I go really slow and I google a lot. I’m on page 99 now, and I’ve learned a lot. A lot of what I’ve learned has been separate from the content, just googling stuff I didn’t understand and reading about this and that. (For example, “what is ogr” and “what is a provider” and “why does my computer’s file paths have backslashes instead of forward slashes”.)

The screenshot below was when I was using PyQGIS to add and style layers on the canvas. That was exciting, because it finally felt like I was doing PyQGIS.

Cracking open the box on PyQGIS

Cracking open the box on PyQGIS

Since I completed the Learn Python 3 course on CodeCademy last week, I have been seeking an introduction to PyQGIS through a few avenues.

I first opened up a textbook called Extending QGIS with Python by Gary Sherman. I was daunted by having to download Python and some other things (Qt5?) that I had never heard of. The way that the book explains how to install these things, I just felt like it assumes I know my way around a computer more than I do. Maybe this book is for a more advanced level than I am. I decided to try out other resources.

I then chatted with chatGPT about learning PyQGIS. I fiddled around with copying different scripts that ChatGPT gave me into the QGIS python console and seeing the outputs. That was valuable, at least in how it showed me how the Python console in QGIS can be used. Additionally, I tried just retyping chatGPT’s scripts into a notepad as an exercise to familiarize myself with the functions and syntax of PyQGIS. I found that I could read and understand a lot more after the Python course I took.

I still felt that learning from a book or tutorial created by a human was a better way, so I thought to try going back to qgistutorials.org for the PyQGIS tutorials there. I’ve already completed many other tutorials produced by Ujaval Gandhi, so they are easy for me to follow. I did the first two (of seven) tutorials. The below map of mean annual rainfall in Seattle was the product of the second tutorial, in which I used the zonal statistics tool on 12 raster layers at once using the Python console.

By the way, the pattern of more rainfall over the mountains is caused by something called orographic lifting, “where moist air is forced to rise over the mountain slopes, causing it to cool and condense into precipitation, leading to heavier rainfall on the windward side of the mountain range”.

The way to Hanoi by backroads

The way to Hanoi by backroads

This is the way to Hanoi by backroads (excluding large highways, and prioritizing small roads over big roads)

I am located in Thai Nguyen city, which is about 80 km North of the Hanoi. The way to get to Hanoi is usually by bus, which travels on the motorway (aka freeway). I wanted to know if I can go to Hanoi on a bicycle, taking the back roads. The goal of this project was to find the optimal route to take by bicycle, with the priority being smaller roads.

First, I created a road network which excludes the major highways.

I know that I don’t want to ride my bicycle on the major highways at all, so I don’t need to include them in my road network. I downloaded from OSM only the highways in the smallest 3 classes.

Second, I prioritized smaller roads over bigger roads.

I prefer smaller roads, even if it means going a slightly greater distance. I want the tool to find the route that takes the smallest roads as much as possible.

Unclassified roads → Most preferred

Tertiary roads → Second priority

Secondary roads → Least preferred

To do this, I basically tell it, ‘smaller roads are faster, bigger roads are slower’. Then I tell it, ‘go find the fastest route’, and so it finds the route with more small roads.

In the attribute table of the highway layer, I used the field calculator to create a new field called ‘speed’. I calculated it as follows:

CASE
  WHEN "highway" IN ('unclassified', 'unclassified_link') THEN 30
  WHEN "highway" IN ('tertiary', 'tertiary_link') THEN 20
  WHEN "highway" IN ('secondary', 'secondary_link') THEN 10
END

I then ran the Shortest Path tool in QGIS with the “Fastest Path” option and the new attribute selected for the “Speed Field”. Since the tool prioritizes higher speeds, roads with higher values in the new field are preferred. The resulting output is more Tertiary highway than anything else.

Finally, to view the route on my mobile phone while out cycling, I imported the route to Google my maps. Thanks to my phone’s GPS, I can see my location as a blue dot.

Planting layout for a desert flower and cactus farm in Central New Mexico

Planting layout for a desert flower and cactus farm in Central New Mexico

Description: A planting layout for a sustainable agriculture model inspired by the environmental conditions of Central New Mexico. Design priorities are drought tolerance, commercial yield and ecological design. The row sequence is A-B-C-B-A where row A is honey mesquite with four-wing saltbush, row B is prickly pear cactus and row C is desert wildflowers. The rows are parallel to the general direction of the contour.