Browsed by
Category: PyQGIS

Process of learning from a textbook

Process of learning from a textbook

In this post, I will write some about how I’ve adapted to learning from a textbook. Though I did learn using a textbook in community college, that was as part of an instructor-led course, so there was more guidance. Since I started learning on my own, I have been using websites which integrate many more screenshots and other supporting features. Now that I have begun learning from a traditional textbook, it requires more initiative and resourcefulness on my part. This was a change, but I feel I have adapted to it.

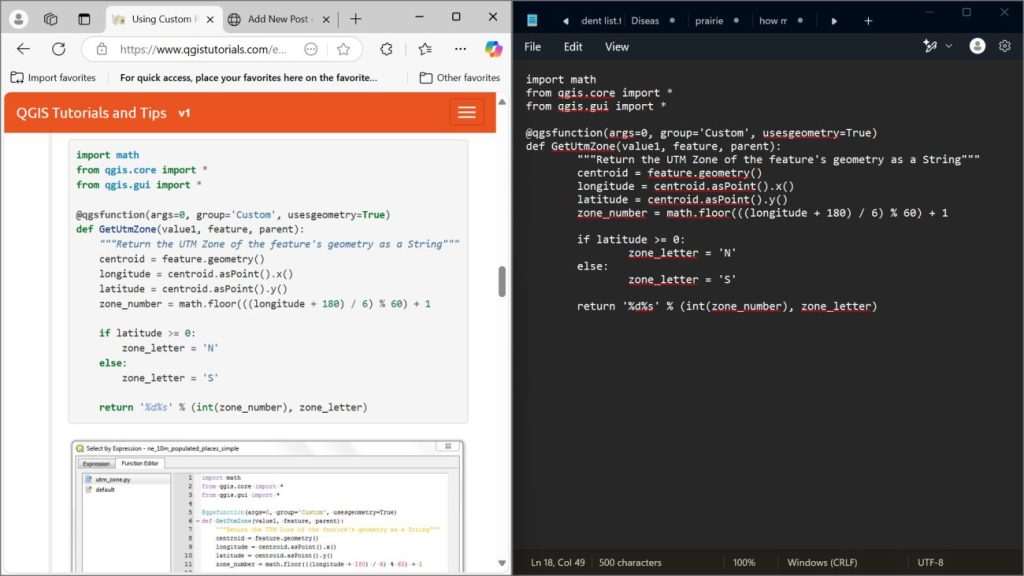
One of the most important things I’ve learned to do is to retype all code I find in the book. I keep the notepad open in a small window at the top of my screen, and any code I see in the book, I retype in the notepad. This helps to examine closely and understand the code in detail.

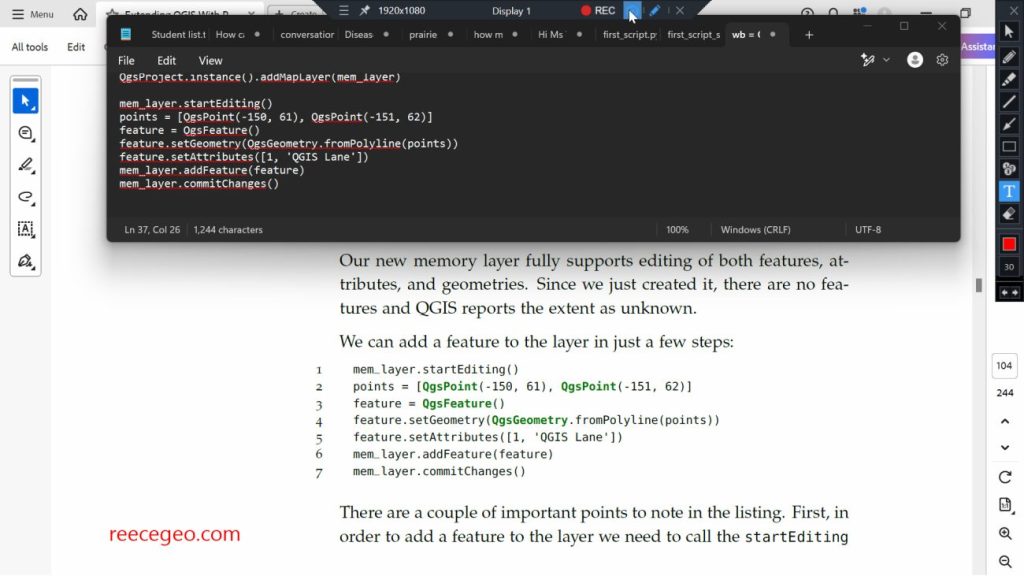
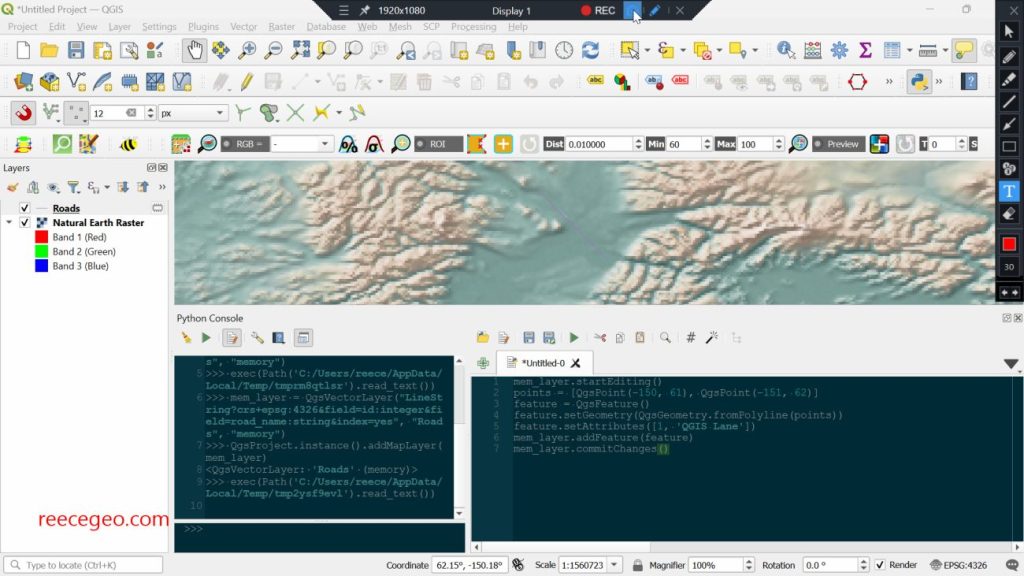
Today, I progressed 5 more pages in the textbook. Below is a screenshot of a temporary memory layer I added (there’s a line between two points, but it’s hard to see).

Beginning to make progress with learning PyQGIS

Beginning to make progress with learning PyQGIS

Since writing my last post, I have both gone on to do another tutorial with qgistutorials.org as well as give the book PyQGIS Programmer’s Guide another try.

In this tutorial from qgistutorials.org, I used a custom Python expression and the map tips feature in QGIS to display the name and UTM zone of a city when you hover the mouse over it (shown in the feature image of this post).

The tutorial itself was easy, since it wasn’t about learning to write the code itself, just how to add the custom expression in QGIS. Still, I retyped the given code into a notepad as a learning exercise.

I’ve also made another attempt to learn from The PyQGIS Programmer’s Guide by Gary Sherman, and this time has had more momentum. The first attempt I was daunted by everything it instructed to do to set up the development environment, such as having Qt5 and having qgis installed in a directory without any spaces in the path, etc. It was a lot to take in. But I took it bit by bit and googled a lot of things, and got past it. I realized that OSGeo4W contains everything I need, and I re-downloaded it to a directory which contains no spaces.

I’ve been going through the book page by page, with QGIS open and looking at both as I go. I go really slow and I google a lot. I’m on page 99 now, and I’ve learned a lot. A lot of what I’ve learned has been separate from the content, just googling stuff I didn’t understand and reading about this and that. (For example, “what is ogr” and “what is a provider” and “why does my computer’s file paths have backslashes instead of forward slashes”.)

The screenshot below was when I was using PyQGIS to add and style layers on the canvas. That was exciting, because it finally felt like I was doing PyQGIS.

Cracking open the box on PyQGIS

Cracking open the box on PyQGIS

Since I completed the Learn Python 3 course on CodeCademy last week, I have been seeking an introduction to PyQGIS through a few avenues.

I first opened up a textbook called Extending QGIS with Python by Gary Sherman. I was daunted by having to download Python and some other things (Qt5?) that I had never heard of. The way that the book explains how to install these things, I just felt like it assumes I know my way around a computer more than I do. Maybe this book is for a more advanced level than I am. I decided to try out other resources.

I then chatted with chatGPT about learning PyQGIS. I fiddled around with copying different scripts that ChatGPT gave me into the QGIS python console and seeing the outputs. That was valuable, at least in how it showed me how the Python console in QGIS can be used. Additionally, I tried just retyping chatGPT’s scripts into a notepad as an exercise to familiarize myself with the functions and syntax of PyQGIS. I found that I could read and understand a lot more after the Python course I took.

I still felt that learning from a book or tutorial created by a human was a better way, so I thought to try going back to qgistutorials.org for the PyQGIS tutorials there. I’ve already completed many other tutorials produced by Ujaval Gandhi, so they are easy for me to follow. I did the first two (of seven) tutorials. The below map of mean annual rainfall in Seattle was the product of the second tutorial, in which I used the zonal statistics tool on 12 raster layers at once using the Python console.

By the way, the pattern of more rainfall over the mountains is caused by something called orographic lifting, “where moist air is forced to rise over the mountain slopes, causing it to cool and condense into precipitation, leading to heavier rainfall on the windward side of the mountain range”.