Greater sage-grouse distribution
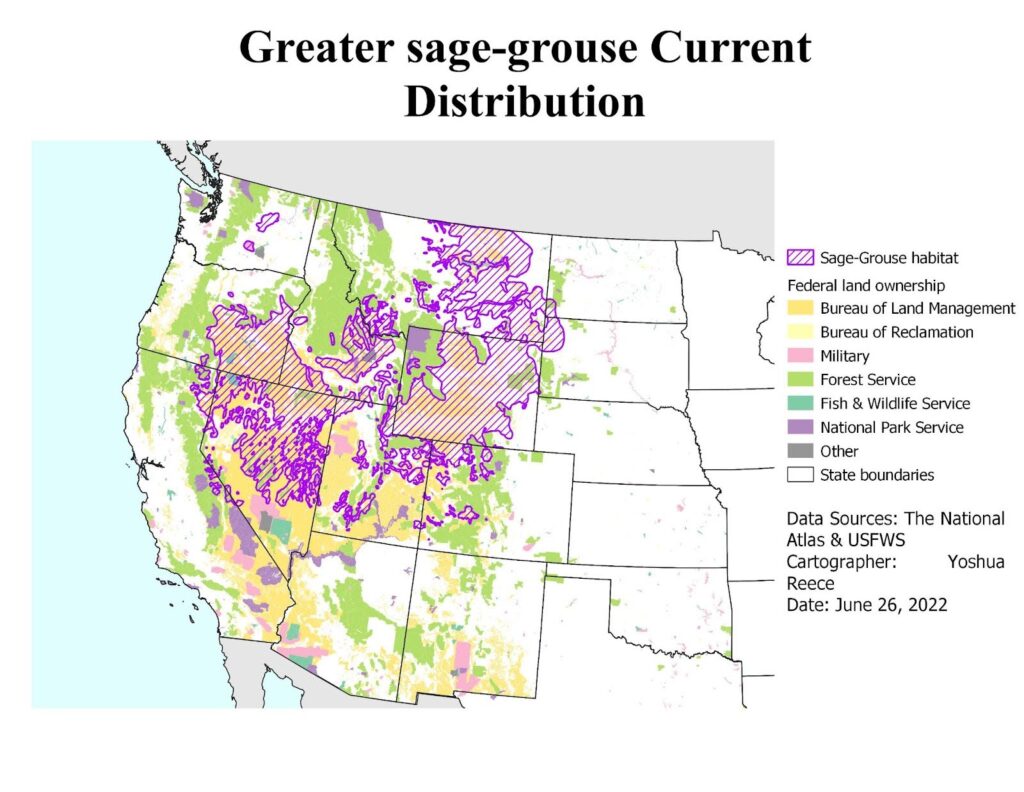
Description: This map shows the current distribution of greater sage-grouse habitat over different types of federal lands. The map was the product of a lab done in the course “Geospatial Technology” taught by the instructor John Beltran at Central New Mexico Community College.